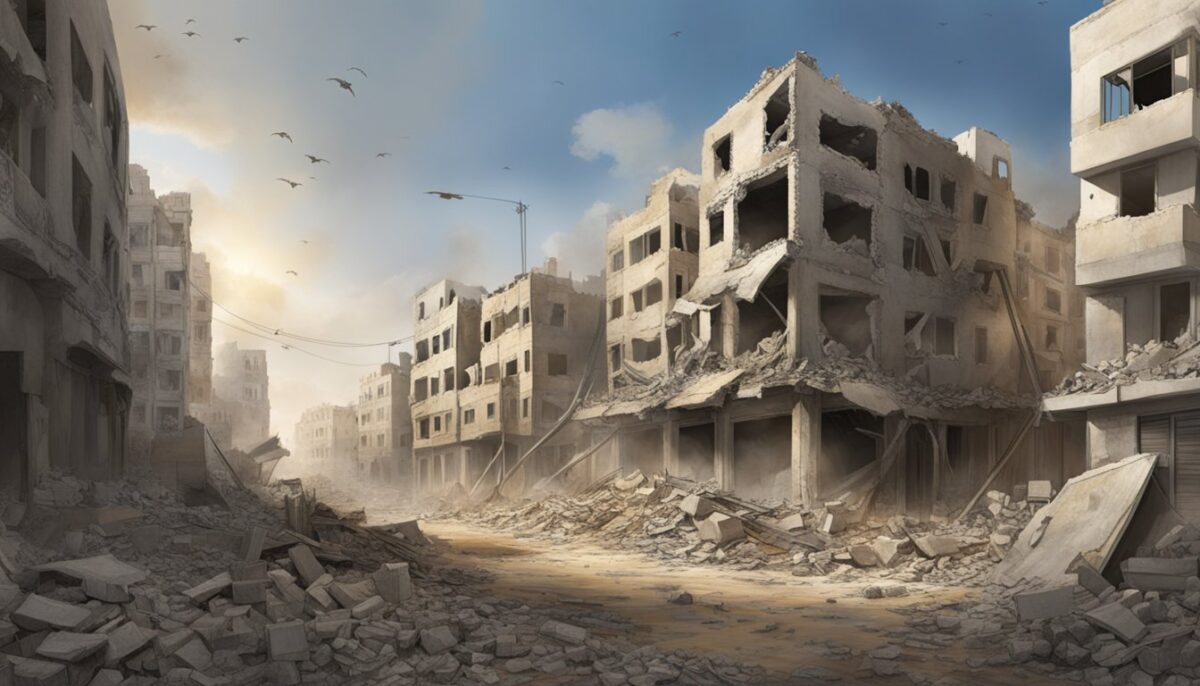
Environmental damage in Gaza is widespread, measurable across almost every built and natural system, and still not fully quantifiable. The April 2026 World Bank–United Nations–European Union assessment estimated 68.1 million metric tonnes of debris, found 88 percent of above-ground water and sanitation assets and 76 percent of underground networks damaged, and reported that 96 percent of cropland was damaged, inaccessible, or both. It placed environment-specific recovery needs at US$2.65 billion and water, sanitation, and hygiene needs at US$4.24 billion within US$71.4 billion in total recovery and reconstruction needs.
Those figures do not amount to one complete “environmental bill.” They measure different forms of damage at different cut-off dates, while groundwater contamination, air-pollution effects, ecosystem losses, and associated health costs remain only partly measured. The most reliable conclusion is that the damage is severe, interconnected, and likely to shape public health, food production, water security, and reconstruction for years.
Last fact-checked: July 16, 2026. The main damage assessment covers the period through October 9, 2025; its debris estimate is dated October 31, 2025. Conditions, access, and recovery funding continue to change.
Environmental damage in Gaza: key figures
| Measure | Latest reported finding | Source and cut-off |
|---|---|---|
| Damaged structures | About 81 percent of all structures; 198,273 structures were identified as affected | UNOSAT, satellite imagery through October 11, 2025 |
| Rubble and debris | 68.1 million metric tonnes | Gaza Rapid Damage and Needs Assessment, estimate dated October 31, 2025 |
| Water and sanitation | 88 percent of above-ground assets and 76 percent of underground networks damaged; all six wastewater treatment plants nonfunctional | World Bank–UN–EU assessment, April 2026 |
| Cropland | 96 percent damaged, inaccessible, or both | World Bank–UN–EU assessment, April 2026 |
| Coastal zone | 83 percent fully or partially destroyed | World Bank–UN–EU assessment, April 2026 |
| Recovery needs | US$2.65 billion for the environment sector, US$4.24 billion for water and sanitation, and US$71.4 billion across all sectors | World Bank–UN–EU assessment, April 2026 |
How the current war began—and what the existing image shows
The current war followed the Hamas-led attacks in southern Israel on October 7, 2023, and Israel’s subsequent air and ground campaign in Gaza. The photograph retained from the original article shows damage in Kibbutz Be’eri, Israel, after the October 7 attacks. It does not show Gaza, so its alt text and caption have been corrected to prevent a misleading visual association.

Why there is no single environmental-damage total
Environmental accounting separates at least three concepts. Damage is the replacement value of destroyed physical assets. Losses include disrupted services and economic activity. Recovery needs estimate what it will cost to clear hazards, restore services, rebuild institutions, and reduce future risks. These categories answer different questions.
The April 2026 assessment valued direct damage within the narrowly defined environment sector at US$151.5 million and losses at US$218.5 million. Yet it estimated US$2.65 billion in environment-sector recovery needs. Water infrastructure, agriculture, housing, health, transport, and municipal waste are counted in other sectors even though their failure also damages soil, groundwater, air, and coastal ecosystems.
The assessment also calls its environmental estimates conservative. Limited field access prevented full measurement of groundwater contamination, air pollution, and broader health costs. For that reason, the US$2.65 billion figure should be read as a planned recovery requirement for a defined sector—not as the total ecological or human cost of the war.
Destroyed buildings have become a hazardous-waste problem
Urban destruction is the most visible environmental impact. UNOSAT’s October 2025 satellite assessment identified 198,273 affected structures, including 123,464 classed as destroyed. The resulting debris blocks roads, restricts humanitarian access, occupies scarce land, and delays the repair of water, electricity, health, and transport systems.
The 68.1 million metric tonnes of rubble is not uniform material that can simply be crushed and reused. It may be mixed with unexploded ordnance, asbestos, fuel residues, industrial chemicals, medical waste, untreated sewage, and human remains. An earlier UN Environment Programme assessment, based on a 61-million-tonne estimate, warned that about 15 percent of the debris could carry a relatively high contamination risk if waste streams are not separated early.
Safe reuse therefore depends on surveying each site, clearing explosive hazards, documenting and recovering human remains with dignity, separating contaminated materials, controlling dust, and testing crushed aggregate before it enters roads or buildings. Recycling can reduce disposal pressure and demand for new raw materials, but indiscriminate crushing could spread contaminants into neighborhoods, soil, and groundwater.
Water, sewage, and groundwater damage
Gaza’s water system was already under severe pressure before October 2023. The war then damaged wells, reservoirs, pipes, desalination facilities, sewage pumps, treatment plants, stormwater systems, and the energy infrastructure needed to operate them. The April 2026 assessment found 88 percent of above-ground water and sanitation assets and 76 percent of underground networks partially or fully damaged.
All six wastewater treatment plants were nonfunctional, 70 percent of sewage pumping stations were inoperable, and 88 percent of stormwater pumping stations were damaged. About 77 percent of households were relying on trucked water. Even underground pipes that appear intact from remote sensing may be unusable because of hidden breaks, pressure loss, cross-contamination, or damage at connected facilities.
- Untreated sewage: Wastewater released onto land or into the Mediterranean can carry pathogens and nutrients into soil, coastal water, and shallow groundwater.
- Damaged stormwater systems: Sewage-contaminated basins and failed pumps increase flood exposure and can spread pollution during heavy rain.
- Reduced recharge: Soil compaction, vegetation loss, and extensive earthworks reduce infiltration, increasing runoff while limiting replenishment of the coastal aquifer.
- Uncertain contamination: Satellite imagery can locate physical damage, but field sampling is required to identify pathogens, salinity, hydrocarbons, heavy metals, and other pollutants.
Gaza also illustrates why water can be renewable yet still become unsafe or unavailable. Natural recharge does not automatically remove salt, pathogens, fuel residues, or toxic substances. Restoring reliable water requires source protection, treatment, energy, testing, distribution, and wastewater management—not only access to a well.
Farmland, soil, and food production
The damage to agriculture combines physical destruction with loss of access. The April 2026 assessment reported that more than 95 percent of agricultural infrastructure had been destroyed and that 96 percent of cropland was damaged, inaccessible, or both. That broader measure includes land farmers could not safely reach as well as land visibly damaged.
A separate FAO–UNOSAT analysis published in October 2025 estimated that nearly 87 percent of cropland was damaged, almost 80 percent of greenhouses were damaged, and about 87 percent of agricultural wells were affected. In June 2026, FAO said approximately 87 percent of cropland remained damaged despite early signs of agricultural recovery. The difference between 87 and 96 percent is not necessarily a contradiction: the assessments used different definitions, and the higher figure includes inaccessible land.
Tree crops are especially difficult to replace. UNEP reported that 97 percent of Gaza’s tree crops, 95 percent of shrubland, and 82 percent of annual crops had been damaged by its 2025 assessment. An annual field may produce again after soil rehabilitation and one successful planting season; an uprooted olive or fruit orchard can take years to return to meaningful production.
Soil damage is not limited to bomb craters. Heavy vehicles and earthworks compact soil, reducing pore space and water infiltration. Vegetation loss exposes topsoil to wind and runoff. Rubble, sewage, fuel, munitions residues, and uncontrolled waste disposal may create local contamination hotspots. Recovery teams will need risk-based soil sampling rather than assuming that every field is equally contaminated—or equally safe.
Damage to the coast, marine environment, and Wadi Gaza
The Mediterranean coast receives pollution generated on land. The April 2026 assessment reported that 83 percent of Gaza’s coastal zone was fully or partially destroyed. It also documented untreated wastewater entering the sea, uncontrolled dumping, open waste burning, and damage to wetlands, grasslands, woodlands, and the Wadi Gaza wetland system.
These impacts weaken natural functions that are easy to overlook in a building-damage count. Wetlands and vegetated land can store water, filter pollutants, moderate flooding, provide habitat, and support livelihoods. Coastal degradation can affect fisheries, recreation, and water quality. Pollution may move with currents or wind beyond the immediate discharge point, but the extent of cross-border marine and atmospheric exposure cannot yet be quantified confidently without sustained monitoring.
Air pollution and the war’s carbon footprint
Air-quality risks come from explosions, fires, building collapse, demolition dust, diesel generators, damaged industrial sites, and open burning of mixed waste. Ground monitoring has been limited, so researchers have relied heavily on satellites. A 2025 study in Global Environmental Change analyzed nitrogen dioxide, sulfur dioxide, carbon monoxide, methane, and an aerosol index before and during the war. It found significant changes in several satellite-observed pollution indicators, while also underscoring the need for better ground-level exposure data.
The greenhouse-gas footprint is even harder to define because results depend on the accounting boundary. A 2026 One Earth study estimated more than 1.3 million tonnes of carbon-dioxide-equivalent emissions from open conflict through January 2025. Its much larger estimate of 33.2 million tonnes included pre-conflict fortification and projected post-conflict reconstruction. These are modeled estimates based on open-source data, not an official emissions inventory.
That distinction matters for reconstruction. Reusing screened debris, reducing transport distances, selecting lower-carbon materials, restoring distributed renewable energy, and rebuilding efficient water systems could reduce future emissions. None of those measures should override explosive-ordnance clearance, contaminant testing, worker protection, or structural safety.
Why the environmental damage is also a public-health crisis
The boundary between environmental damage and human harm is artificial. Failed sewage treatment raises the risk of waterborne disease. Dust and smoke can worsen respiratory exposure. Unexploded ordnance makes homes, roads, farms, and rubble-processing sites dangerous. Polluted soil and coastal water undermine farming and fishing. Damaged drainage and compacted land increase flood risk, while vegetation loss reduces shade and local cooling.
Exposure is also unequal. Children, older people, people with disabilities, displaced families, waste workers, farmers, and crews handling debris may face higher risks or have fewer ways to avoid them. A credible recovery plan therefore needs public-health surveillance, accessible warnings, protective equipment, community participation, and transparent publication of testing results—not only engineering contracts.
What environmental recovery should prioritize
Environmental recovery cannot proceed at full scale without sustained safe access, a stable operating environment, fuel and machinery, functioning institutions, and protection for workers and civilians. Within those constraints, the evidence points to a clear sequence of priorities.
- Map immediate hazards. Survey unexploded ordnance, unstable structures, human remains, asbestos, medical waste, industrial materials, and suspected contamination hotspots before mass clearance.
- Restore essential water and waste services. Repair priority water lines, desalination and pumping capacity, sewage collection and treatment, stormwater systems, medical-waste handling, and controlled solid-waste sites.
- Build a field-monitoring network. Sample groundwater, drinking water, soil, dust, coastal water, sediments, and food-producing areas using published methods and repeatable locations.
- Separate, test, and recycle debris safely. Reuse clean mineral material where engineering standards allow, while isolating hazardous streams and protecting workers and nearby residents from dust.
- Rehabilitate food-producing land. Restore wells, irrigation, access roads, greenhouses, nurseries, orchards, fisheries infrastructure, and soil health, with priority based on safety and food-production potential.
- Rebuild for climate and resource constraints. Use water-efficient systems, distributed energy, flood-aware drainage, lower-carbon construction where safe, and locally accountable environmental governance.
Time estimates depend on access and capacity. In November 2025, UNDP said most rubble could be cleared in seven years under the right conditions. The April 2026 assessment modeled debris removal and management over a 10-year horizon. Soil, aquifer, wetland, orchard, and coastal recovery may continue beyond the physical clearance of rubble.
Funding has begun to move toward early recovery. On July 13, 2026, the European Commission announced an initial €883.6 million Team Gaza Initiative covering water and sanitation, debris and solid waste, health, energy, agriculture, and food systems. It is not directly comparable with the US$71.4 billion estimate because the currencies, contributors, time horizons, and scopes differ. It is best understood as an initial package rather than full financing for recovery.
What remains unknown
Remote sensing can show damaged buildings, vegetation loss, land disturbance, and some pollution patterns. It cannot determine the concentration of a contaminant in a well, whether a specific field is safe to cultivate, how much asbestos is airborne at a worksite, or how ecological exposure will affect health over decades.
The largest evidence gaps are the condition of the coastal aquifer, the location and chemistry of soil hotspots, exposure to dust and smoke, the status of marine sediments and fisheries, biodiversity loss, and long-term health effects. New figures should therefore be dated, attributed, and compared only when definitions match. Greater precision will require safe access and independent field testing.
Frequently asked questions
How much rubble is in Gaza?
The April 2026 World Bank–UN–EU assessment estimated 68.1 million metric tonnes of debris as of October 31, 2025. Not all of it is hazardous, but portions may be mixed with unexploded ordnance, asbestos, medical waste, fuel residues, sewage, or other contaminants.
What happened to Gaza’s water and sewage systems?
The assessment found 88 percent of above-ground water and sanitation assets and 76 percent of underground networks damaged. All six wastewater treatment plants were nonfunctional, and about 77 percent of households relied on trucked water.
How much of Gaza’s farmland has been damaged?
The April 2026 assessment reported that 96 percent of cropland was damaged, inaccessible, or both. FAO said in June 2026 that approximately 87 percent remained physically damaged; the figures differ because the definitions are not identical and the higher figure includes inaccessible land.
Can pollution from Gaza spread beyond its borders?
Potentially. Sewage, marine debris, smoke, and airborne dust can move through water or air. However, the distance, concentration, and health significance of cross-border pollution have not been quantified comprehensively.
How long could Gaza’s environmental recovery take?
Rubble clearance alone is likely to take years. UNDP said most debris could be cleared in seven years under favorable conditions, while the April 2026 assessment modeled debris management over 10 years. Recovery of groundwater, soils, orchards, wetlands, and coastal ecosystems may take longer.
The scale is clear even where the full cost is not
Gaza’s environmental damage cannot be reduced to one statistic. The best available evidence shows a territory-wide crisis involving urban rubble, explosive hazards, failed water and sewage systems, damaged farmland, compacted and potentially contaminated soil, coastal degradation, air pollution, and years of difficult recovery.
The headline numbers—68.1 million metric tonnes of debris, 96 percent of cropland damaged or inaccessible, 88 percent of above-ground water and sanitation assets damaged, and US$71.4 billion in total recovery needs—are already extraordinary. They are also conservative in important areas. The next stage of credible assessment depends on safe access, field sampling, transparent data, and recovery decisions that protect both people and the environment.
See Related: Unearth the Value: How Much Is a Megalodon Tooth Worth Today?