Last verified: July 16, 2026.
The world is adding renewable power faster than ever, but it is not yet on track to triple global renewable energy capacity by 2030. Renewable capacity reached 5,149 gigawatts at the end of 2025. The benchmark consistent with the COP28 goal is approximately 11,170 gigawatts, leaving a gap of about 6,021 gigawatts in five years.
Closing that gap would require the world to add an average of roughly 1,204 gigawatts of renewable capacity every year from 2026 through 2030. That is about 74% more than the record 692 gigawatts added in 2025. The target is global rather than a requirement for the United States, European Union, or every individual country to triple its own installed capacity.
The challenge is no longer limited to manufacturing more solar panels and wind turbines. Countries also need faster grid connections, transmission expansion, storage, lower-cost financing, credible national targets, skilled workers, and permitting systems that protect communities and ecosystems while avoiding unnecessary delay.
Key Takeaways
- COP28 established a global goal. The final agreement calls on countries to contribute to tripling renewable capacity and doubling the annual rate of energy-efficiency improvement by 2030 in nationally determined ways.
- Renewable capacity reached 5.15 terawatts in 2025. The 2030 benchmark is about 11.17 terawatts, leaving more capacity to build than the world had installed in total at the end of 2025.
- Current forecasts remain below the goal. The International Energy Agency’s main case reaches about 2.6 times the 2022 capacity level by 2030 rather than three times.
- Solar and wind will provide most new capacity. Together, they accounted for 96.8% of net renewable additions in 2025.
- Deployment is geographically uneven. Asia accounted for nearly three-quarters of 2025 additions, while Africa held only 1.6% of global renewable capacity at year-end.
What the COP28 Renewable Energy Agreement Actually Means
At COP28 in Dubai, governments completed the first global stocktake of progress under the Paris Agreement. The resulting UN climate decision calls on parties to contribute, in nationally determined ways, to tripling renewable energy capacity globally and doubling the global average annual rate of energy-efficiency improvements by 2030.
The final text also calls for accelerating zero- and low-emission technologies, reducing unabated coal power, phasing out inefficient fossil-fuel subsidies that do not address energy poverty or just transitions, and transitioning away from fossil fuels in energy systems in a just, orderly, and equitable manner.
A separate Global Renewables and Energy Efficiency Pledge set a more numerical objective: at least 11,000 gigawatts of installed renewable capacity by 2030 and an increase in the annual energy-efficiency improvement rate from roughly 2% to more than 4%. The final negotiated COP decision extended the central direction of travel to the wider UN climate process, but it did not assign an identical quota to every country.
The target is global, not a uniform national quota
A country that already has a high renewable share, limited land, or a mature power system may contribute differently from a rapidly growing economy with rising electricity demand. National contributions can include renewable deployment, grid investment, regional power trading, efficiency improvements, technology finance, supply-chain development, and support for lower-income markets.
This distinction matters when evaluating the United States and European Union. Their policies, capital markets, technology companies, trade rules, and historical emissions give them substantial influence, but neither can deliver the global target alone. China is currently responsible for most annual capacity growth, India is expanding rapidly, and developing economies need far more affordable capital and grid investment.
Renewable capacity and energy efficiency measure different things
Renewable capacity measures the maximum rated output of installed power plants, usually in megawatts or gigawatts. It does not measure how much electricity those plants generate during a year. Energy efficiency is generally tracked through energy intensity: the amount of energy required to produce a unit of economic output.
| Common shorthand | More accurate meaning |
|---|---|
| “The U.S. and EU will each triple renewables” | The agreement establishes a global target. Countries contribute through different national pathways rather than identical tripling quotas. |
| “Energy savings must double” | The goal is to approximately double the annual rate of improvement in global energy intensity, not simply to cut every country’s total energy use in half. |
| “The world needs 11 TW of renewable electricity” | The target concerns installed renewable power capacity. Actual electricity generation depends on weather, plant performance, curtailment, storage, and grid availability. |
| “Tripling renewables will secure 1.5°C” | Tripling is a central part of a 1.5°C-aligned pathway, but it must be combined with efficiency, electrification, methane reductions, fossil-fuel displacement, and action outside the power sector. |
How Close Is the World to Tripling Renewable Capacity?
The most recent IRENA capacity data show that renewable power grew by a record 692 gigawatts in 2025, a 15.5% annual increase. Renewable sources accounted for 85.6% of all net power-capacity expansion during the year and reached 49.4% of total installed power capacity worldwide.
| Indicator | Latest position | 2030 requirement or benchmark |
|---|---|---|
| Global renewable power capacity | 5,149 GW at the end of 2025 | Approximately 11,170 GW |
| Remaining capacity gap | Approximately 6,021 GW | Must be added by the end of 2030 |
| Annual renewable additions | 692 GW added in 2025 | Average of about 1,204 GW per year from 2026–2030 |
| Annual build-rate increase | 2025 set a record | Average annual additions must be about 74% above the 2025 record |
| Energy-efficiency improvement | Estimated at 1.8% in 2025 | Approximately 4% per year |
The scale of the remaining work is easy to underestimate. The approximately 6.02 terawatts still needed is greater than all renewable power capacity operating worldwide at the end of 2025. Maintaining the 2025 record would not be enough; annual deployment must rise sharply and remain elevated through the end of the decade.
Solar and wind are driving nearly all new capacity
At the end of 2025, global renewable capacity included approximately:
- 2,392 GW of solar power
- 1,296 GW of hydropower
- 1,291 GW of wind power
- 154 GW of bioenergy
- 16 GW of geothermal power
- About 0.5 GW of marine energy
Solar and wind represented 96.8% of net renewable additions in 2025. Solar alone supplied most of the growth because photovoltaic modules can be deployed at scales ranging from individual rooftops to multi-gigawatt projects. Wind remains essential for geographic and seasonal diversity, although turbine permitting, transmission access, supply-chain constraints, and offshore-project economics can slow development.
Technology growth is also concentrated geographically. Asia added 513.3 gigawatts in 2025, equal to 74.2% of the global total. China alone added approximately 440.1 gigawatts. Europe added 76.8 gigawatts, North America 42.1 gigawatts, and Africa 11.3 gigawatts.
Are Current Policies Enough to Reach the 2030 Target?
Not yet. The IEA’s Renewables 2025 main case projects approximately 4,600 gigawatts of new renewable capacity from 2025 through 2030. That would take the world to roughly 2.6 times its 2022 capacity level, below the tripling goal. Even the accelerated case reaches about 2.8 times the baseline and slightly more than 10,400 gigawatts.
The forecast does not imply that tripling is technically impossible. It shows that current policy settings, project pipelines, grid conditions, financing arrangements, and implementation rates remain insufficient. Faster growth could still narrow the gap, but it would require sustained action rather than a single record year.
National climate plans also lag behind the global commitment. In its December 2025 progress assessment, the IEA found that 128 parties had submitted updated nationally determined contributions by the end of COP30. Only 53 explicitly referred to tripling renewable capacity, and only 32 contained quantifiable 2030 renewable-capacity ambitions.
Policies and plans across 189 countries implied approximately 8,355 gigawatts of renewable capacity by 2030. That is a significant expansion but remains well below the roughly 11,000-gigawatt political pledge and IRENA’s 11.17-terawatt pathway benchmark.
Why the United States and European Union Matter
The original U.S.-EU initiative helped build diplomatic support for the COP28 pledge. Their continuing importance comes from more than the amount of renewable capacity they install domestically. Both influence global technology costs, manufacturing standards, project finance, corporate procurement, research, trade, and development assistance.
United States: strong additions, but a less certain outlook
Renewable sources supplied about 24% of U.S. utility-scale electricity generation in 2025. Wind and solar together reached a record 17% of total U.S. electricity generation, according to the Energy Information Administration. Wind generated approximately 464 terawatt-hours, while utility-scale and small-scale solar together generated about 389 terawatt-hours.
IRENA recorded 34 gigawatts of U.S. solar-capacity additions during 2025. Solar development, battery deployment, corporate power-purchase agreements, state policies, and utility investment continue to support growth.
However, the IEA reduced its U.S. 2025–2030 renewable forecast by almost half compared with its previous outlook, citing policy changes and weaker expectations for both wind and solar. Forecasts can change again, but the revision illustrates how tax policy, tariffs, permitting, public-land rules, transmission approvals, and project finance can alter deployment well before physical resource limits become relevant.
European Union: high renewable electricity, slower total-energy transition
Renewables generated 47.3% of EU electricity in 2025. This is an important milestone, but it should not be confused with the renewable share of the EU’s entire energy system.
Electricity is only one part of total energy use. Transport fuels, industrial heat, building heat, and other direct fuel consumption are included in gross final energy consumption. On that broader measure, renewables supplied 25.2% in 2024.
Under the revised Renewable Energy Directive, the EU has a binding target of at least 42.5% renewables in gross final energy consumption by 2030, with an ambition to reach 45%. Reaching it requires continued growth in renewable electricity alongside building renovation, heat pumps, industrial electrification, renewable heat, cleaner transport, and energy efficiency.
China, India, and developing markets determine the global outcome
China added more renewable capacity in 2025 than every other region combined, including approximately 315.1 gigawatts of solar and 119.4 gigawatts of wind. The IEA expects China to account for nearly 60% of global renewable-capacity growth through 2030.
India added approximately 37 gigawatts of solar and 6.3 gigawatts of wind in 2025. The IEA expects its renewable capacity to increase roughly two-and-a-half times over five years, placing it among the major markets closest to its national 2030 ambition.
The more difficult gap lies across many lower-income and emerging markets. Africa had only about 82 gigawatts of renewable capacity at the end of 2025, or 1.6% of the global total, despite strong solar, wind, hydro, and geothermal resources in many countries. High borrowing costs, currency risk, weak utilities, limited transmission, smaller project pipelines, and insufficient access to long-term capital can make otherwise competitive projects difficult to finance.
What Must Change to Reach the Renewable Energy Goal?
1. Expand grids and connect projects faster
Installing renewable generators is not enough if the grid cannot connect or use them. The IEA estimates that more than 2,500 gigawatts of renewable, storage, and large-load projects are waiting in grid connection queues worldwide.
Some queued projects will never be built, so the total is not a direct measure of future capacity. It nevertheless signals severe congestion in interconnection studies, transmission planning, equipment procurement, and project approval.
Solutions vary by market but include building high-voltage transmission, strengthening distribution networks, using dynamic line ratings and other grid-enhancing technologies, improving queue management, sharing grid data, accelerating transformer and cable manufacturing, and planning generation and transmission together rather than sequentially.
2. Improve permitting without weakening safeguards
Lengthy, duplicative, and unpredictable reviews can delay low-impact projects and transmission lines for years. Better permitting should establish clear timelines, coordinate agencies, identify suitable development zones early, digitize applications, and give developers predictable information requirements.
Speed should not mean eliminating environmental review or public participation. Poorly planned renewable projects can fragment habitat, disrupt migration routes, alter river systems, compete for land, or burden communities that receive few benefits. Early consultation, cumulative-impact assessment, responsible siting, wildlife monitoring, Indigenous participation, fair compensation, and community-benefit agreements can reduce both ecological harm and later conflict.
3. Add storage, flexibility, and demand response
Solar and wind output changes with weather and time of day. Power systems can integrate high shares through a portfolio of flexible resources: batteries, pumped-storage hydropower, reservoir hydropower, thermal storage, stronger regional interconnections, demand response, managed electric-vehicle charging, flexible industrial loads, and dispatchable low-emission generation.
Battery economics are improving quickly. IRENA estimated the installed cost of a four-hour utility-scale battery system at about $140 per kilowatt-hour in 2025, roughly 30% below the previous year and about 95% below 2010 levels. Batteries are not a substitute for every grid investment or for long-duration balancing, but they can reduce curtailment, shift solar output into evening hours, and provide fast-response grid services.
4. Reduce financing costs where renewable resources are strongest
Solar and wind projects require most of their spending before they begin generating electricity. Their economics are therefore highly sensitive to interest rates, perceived country risk, currency volatility, contract enforcement, and the financial strength of the electricity buyer.
A project with excellent solar resources can still produce expensive electricity when its cost of capital is high. Competitive auctions, credible power-purchase agreements, transparent grid rules, concessional loans, guarantees, currency-risk instruments, development-bank participation, and predictable regulation can lower project risk without concealing the real cost from taxpayers or consumers.
Finance should also support grid infrastructure, project preparation, local technical capacity, and smaller distributed-energy projects. Funding generation without strengthening the surrounding power system can create stranded or curtailed capacity.
5. Double the rate of energy-efficiency improvement
Renewable deployment receives more attention, but the efficiency target is equally important. The IEA estimated global energy-efficiency progress at 1.8% in 2025, an improvement from roughly 1% in 2024 but less than half the approximately 4% annual rate associated with the COP28 goal.
Efficiency reduces the amount of new generation, storage, transmission, fuel, and critical minerals needed to provide the same services. Important measures include stronger building codes, insulation, efficient cooling, heat pumps, appliance standards, industrial motors, waste-heat recovery, public transit, efficient vehicles, and digital energy-management systems.
Efficiency policy must account for rebound effects and unequal access. An efficient air conditioner can reduce electricity use per hour, but total demand may still grow as more households gain access to safe cooling. That access is socially valuable; planning should distinguish waste reduction from the legitimate growth of essential energy services.
6. Convert international goals into investable national plans
Global declarations do not automatically produce land rights, grid connections, equipment orders, trained workers, or financing. Governments need measurable national targets, competitive procurement schedules, grid plans, permitting reforms, workforce programs, and credible implementation budgets.
Targets should also distinguish between capacity that has been announced, permitted, financed, connected, and commissioned. Large headline pipelines can overstate progress when projects remain speculative or compete for the same limited grid capacity.
Which Renewable Technologies Will Deliver the Buildout?
Solar and wind will provide most new capacity
Solar PV is likely to remain the largest source of additions because it is modular, increasingly cost-competitive, and usable in residential, commercial, industrial, and utility-scale projects. Wind can complement solar by generating at different times and seasons, but development timelines are often longer.
The best technology mix depends on local resources, electricity demand, available land, transmission, financing, and system needs. Our comparison of how solar and wind compare explains their different resource requirements, operating profiles, and environmental tradeoffs.
Hydropower and geothermal can provide firmer output
Reservoir hydropower can supply dispatchable generation and energy storage, while geothermal plants can provide steady output in regions with suitable resources. Both can help balance variable solar and wind, but neither is impact-free.
Large dams can alter river flow, sediment movement, fisheries, habitats, and community access to land and water. Geothermal development can face drilling risk, water-management concerns, induced seismicity, and location constraints. Project-level assessment remains essential.
Bioenergy requires strict sustainability criteria
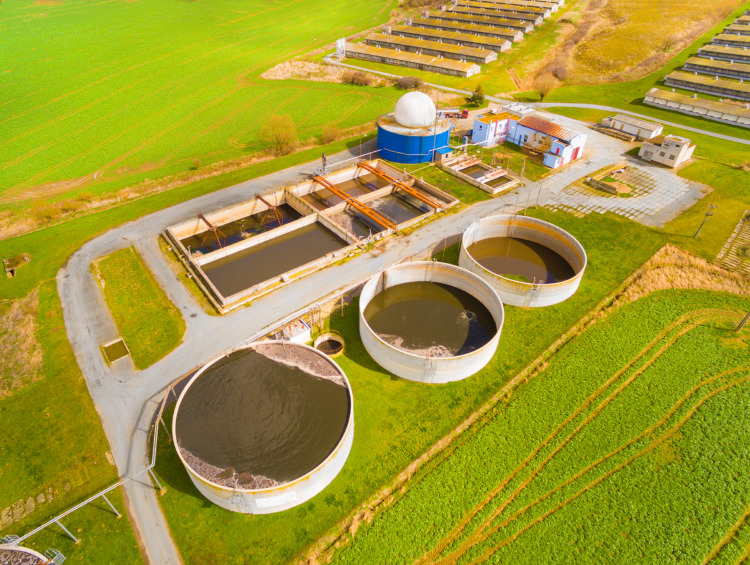
Bioenergy and biogas can provide controllable electricity and heat, particularly when they use genuine waste streams such as manure, sewage, food waste, or some agricultural residues. They can also create methane or air-pollution problems when feedstocks, digesters, combustion systems, or supply chains are poorly managed.
Calling a fuel “renewable” does not establish that it is low-carbon. Lifecycle emissions depend on feedstock origin, land-use change, collection and transport, methane leakage, combustion efficiency, and the time required for biological carbon to be reabsorbed. Purpose-grown biomass that competes with food production or natural ecosystems deserves especially careful scrutiny.
What Tripling Renewables Could Mean for Costs, Jobs, and Communities
Lower generation costs do not eliminate system costs
According to IRENA’s 2025 cost assessment, more than 90% of newly commissioned utility-scale renewable capacity generated electricity more cheaply than the lowest-cost new fossil-fuel alternative. The global weighted-average levelized cost was approximately $33 per megawatt-hour for onshore wind, $44 for utility-scale solar PV, and $78 for offshore wind.
These generation-cost comparisons do not include every expense of operating a reliable power system. Transmission, distribution, storage, balancing, backup capacity, market reform, and early retirement of existing assets can all affect consumer bills. Fossil-fuel systems also impose integration, infrastructure, volatility, pollution, and climate costs that are often treated separately.
The practical objective is not to select the technology with the lowest isolated generation cost. It is to build the lowest-cost reliable system that meets demand, protects public health, reduces emissions, and distributes risks and benefits fairly.
Employment will grow, but workforce policy matters
The ILO and IRENA estimated 16.6 million renewable-energy jobs worldwide in 2024. Faster deployment can increase demand for electricians, engineers, construction workers, planners, technicians, project managers, environmental specialists, factory workers, and grid operators.
Job totals alone do not reveal job quality, location, security, wages, or access. A just transition requires retraining, recognized qualifications, safe working conditions, labor rights, regional economic planning, and support for workers and communities affected by fossil-fuel closures.
Local participation can reduce conflict and improve projects
Renewable infrastructure occupies land and changes landscapes. Communities may support national climate goals while opposing projects they perceive as unfair, ecologically damaging, or imposed without meaningful participation.
Developers and governments can reduce conflict through early engagement, transparent benefit sharing, local ownership options, fair lease terms, wildlife-sensitive siting, decommissioning plans, recycling requirements, and clear complaint processes. These measures are not public-relations substitutes for good design; they are part of durable infrastructure planning.
What Tripling Renewable Capacity Does Not Solve on Its Own
- Capacity does not equal generation. One gigawatt of solar, wind, hydro, and geothermal capacity will not produce the same annual electricity because operating profiles and capacity factors differ.
- New renewables do not automatically displace fossil fuels. Electricity demand may grow faster than clean generation, or fossil plants may remain online for reliability, market, political, or contractual reasons.
- A global total does not guarantee equitable access. Most new capacity can be concentrated in already-large markets while countries with low electricity access receive little investment.
- Power-sector deployment is not the entire climate strategy. Industry, transport, buildings, agriculture, land use, methane, and non-carbon greenhouse gases also require action.
- Renewable projects still require environmental governance. Poor siting or weak supply-chain standards can harm habitats, water systems, workers, and communities.
Fossil-fuel terminology also requires care. Natural gas is still a fossil fuel even when it produces less carbon dioxide at combustion than coal. Methane leakage across production and transport can materially increase its climate impact.
The Intergovernmental Panel on Climate Change uses “unabated fossil fuels” to describe fossil fuels produced and used without interventions that substantially reduce lifecycle greenhouse-gas emissions. A small capture project or a promise to add carbon capture later does not necessarily make a facility meaningfully abated. Capture rates, upstream methane, energy penalties, transport, storage permanence, and the project’s full lifecycle all matter.
Six Indicators to Watch Through 2030
- Annual capacity additions: Global deployment needs to move from 692 gigawatts in 2025 toward an average of approximately 1,204 gigawatts per year.
- Completed grid connections: Track commissioned projects rather than announcements or queue entries alone.
- Energy-efficiency progress: The annual global improvement rate needs to rise from an estimated 1.8% toward approximately 4%.
- National implementation: Updated NDCs, auctions, grid plans, permitting reforms, and budgets should converge with the global goal.
- Geographic distribution: Growth in Africa, Latin America, Southeast Asia, island states, and lower-income markets should accelerate rather than leave deployment concentrated in a few economies.
- Delivered clean electricity and emissions: Renewable generation, curtailment, fossil-fuel output, electricity access, and power-sector emissions reveal more than nameplate capacity alone.
The Bottom Line
Renewable energy is expanding at a record pace, and the economics of solar, wind, and battery storage continue to improve. Those developments make the COP28 target more credible than it would have appeared a decade ago.
Record growth is not the same as being on track. With 5.15 terawatts installed at the end of 2025 and roughly 11.17 terawatts needed by 2030, the remaining buildout is larger than the world’s entire existing renewable fleet. Annual additions must rise substantially while grids, efficiency, financing, permitting, workforce capacity, and national policies improve at the same time.
The most useful measure of progress is therefore not another international announcement. It is the amount of renewable capacity that is financed, responsibly sited, connected, generating electricity, and displacing higher-emission energy each year.
Frequently Asked Questions
What does tripling renewable energy capacity by 2030 mean?
It means increasing global installed renewable power capacity to roughly three times its 2022 level by the end of 2030. The current benchmark is approximately 11.17 terawatts. It refers to nameplate generating capacity, not the amount of electricity generated during a year.
Is the COP28 renewable energy target legally binding?
The target is a negotiated COP outcome and international political commitment, but it does not impose an identical, legally enforceable tripling quota on every country. Delivery depends on national laws, climate plans, energy policies, budgets, project approvals, and investment decisions.
How much renewable energy capacity is installed worldwide?
IRENA reported 5,149 gigawatts, or 5.15 terawatts, of renewable power capacity at the end of 2025. Solar accounted for about 2,392 gigawatts, hydropower 1,296 gigawatts, and wind 1,291 gigawatts.
Is the world on track to triple renewable capacity by 2030?
Not under current policies and project conditions. The IEA’s main forecast reaches about 2.6 times the 2022 capacity level by 2030. Its accelerated case reaches about 2.8 times, which also remains below the tripling goal.
Does every country need to triple its own renewable capacity?
No. The COP28 decision describes a global goal and asks countries to contribute in nationally determined ways. Appropriate contributions differ according to energy demand, existing capacity, resources, grid conditions, development needs, finance, and national circumstances.
Why must energy-efficiency progress double?
Efficiency reduces the generation, grid capacity, storage, fuel, and materials needed to provide energy services. The COP28 goal seeks to increase the global annual improvement rate from roughly 2% to more than 4%, while the IEA estimated progress at 1.8% in 2025.
Which technologies will add most of the renewable capacity?
Solar PV and wind are expected to provide most additions. Together they accounted for 96.8% of net renewable-capacity growth in 2025. Hydropower, geothermal, sustainable bioenergy, storage, and flexible demand also have important system roles.
What does unabated fossil fuel use mean?
The IPCC uses the term for fossil fuels produced and used without measures that substantially reduce lifecycle greenhouse-gas emissions. Evaluating whether a project is meaningfully abated requires considering capture rates, methane leakage, energy penalties, transport, storage, and permanence.