
Among established electricity sources, wind and nuclear power produce the least greenhouse gases over their full life cycles. The National Renewable Energy Laboratory’s 2021 review reports a median of about 13 grams of carbon dioxide equivalent per kilowatt-hour (g CO2e/kWh) for both. Ocean energy appears lower at 8 g CO2e/kWh in the same dataset, but that estimate is based on far fewer studies and should not be treated as a settled winner.
The key phrase is full life cycle. Wind turbines, solar panels, nuclear reactors, and hydropower facilities may have little or no direct greenhouse gas emissions while generating electricity, yet mining, manufacturing, construction, fuel supply, maintenance, and decommissioning still create emissions. Comparing those stages on the same basis gives a more useful answer for climate change decisions.
Key takeaways
- Lowest established sources: Wind and nuclear are tied at roughly 13 g CO2e/kWh in NREL’s published median comparison.
- Lowest published median, with limited evidence: Ocean energy is listed at 8 g CO2e/kWh, but NREL’s figure draws on only 10 estimates from five references.
- Low-carbon does not mean zero-impact: Solar, hydropower, geothermal, wind, and nuclear each have location-specific tradeoffs involving land, water, materials, biodiversity, waste, reliability, or cost.
- Highest emitters: Coal, oil, and natural gas remain far more greenhouse-gas-intensive than low-carbon electricity sources.
Greenhouse gas emissions by energy source
The table below uses median published life-cycle emissions from NREL’s 2021 systematic review. The values compare electricity generation in the same unit: grams of CO2 equivalent per kilowatt-hour.
| Electricity source | Median life-cycle emissions (g CO2e/kWh) | How to interpret the figure |
|---|---|---|
| Ocean energy | 8 | Lowest listed median, but supported by a small evidence base, so the ranking is less certain. |
| Wind | 13 | Land-based and offshore wind combined; most emissions come from materials and construction. |
| Nuclear | 13 | Includes the fuel cycle, construction, operations, decommissioning, and waste-related stages covered by the studies. |
| Hydropower | 21 | Often very low, but reservoir methane can raise emissions sharply at some sites. |
| Concentrating solar power | 28 | Emissions come mainly from infrastructure, materials, construction, and maintenance. |
| Geothermal | 37 | Results vary with geology, drilling requirements, reservoir chemistry, and plant design. |
| Solar photovoltaic | 43 | A cross-study median; newer systems can be lower, depending on manufacturing and solar resource. |
| Biomass | 52 | Highly sensitive to feedstock, land-use change, regrowth, transport, and carbon-accounting assumptions. |
| Natural gas | 486 | Includes combustion emissions and upstream methane and supply-chain emissions. |
| Oil | 840 | High direct combustion emissions make oil a carbon-intensive electricity source. |
| Coal | 1,001 | The highest median in NREL’s comparison because most emissions occur during combustion. |
Source note: NREL reviewed about 3,000 life-cycle studies and applied quality, relevance, and transparency screening. The IPCC’s harmonized comparison uses different study sets and reports slightly different medians—11 g CO2e/kWh for onshore wind and 12 for nuclear and offshore wind—but reaches the same broad conclusion that wind and nuclear sit in the lowest-emission tier among established sources.
What life-cycle emissions measure
Greenhouse gases include carbon dioxide, methane, nitrous oxide, and fluorinated gases. Because these gases do not warm the atmosphere equally, researchers express them as carbon dioxide equivalent, or CO2e. The U.S. Environmental Protection Agency explains CO2e as a way to compare different gases using their global warming potential.
A life-cycle assessment can include raw-material extraction, component manufacturing, plant construction, fuel production and delivery, operations, maintenance, decommissioning, disposal, and recycling. The exact system boundary varies among studies, which is one reason published figures do not always match.
This article compares electricity generation. A fuel measured in grams per megajoule cannot be compared directly with electricity measured in grams per kilowatt-hour unless the units and system boundaries are converted consistently. Mixing those units can produce a misleading ranking.
Why no single number is universal
Life-cycle emissions vary with equipment efficiency, plant lifetime, capacity factor, fuel quality, construction materials, manufacturing location, grid mix, transport distance, local climate, and end-of-life treatment. A well-sited project can perform much better than the published median; a poorly designed project can perform worse.
That is especially important for hydropower and biomass, where biological processes and land-use choices can dominate the result. It also matters for solar power, because a panel manufactured with low-carbon electricity and installed in a sunny location will usually have lower emissions per kilowatt-hour than the same panel made with coal-heavy electricity and installed in a low-sun location.
How the major energy sources compare
Ocean energy: a low estimate with a small evidence base
Wave and tidal power have the lowest median in NREL’s table at 8 g CO2e/kWh. That figure is promising, but it comes from only 10 estimates across five references. With far fewer life-cycle studies than wind, solar, or nuclear, the uncertainty is greater.
For a practical answer based on a much larger body of evidence, wind and nuclear are better-supported candidates for the lowest-emission source.
Wind power: one of the lowest-emission established options
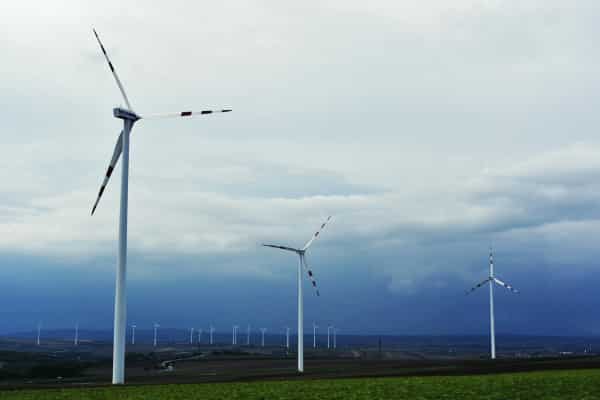
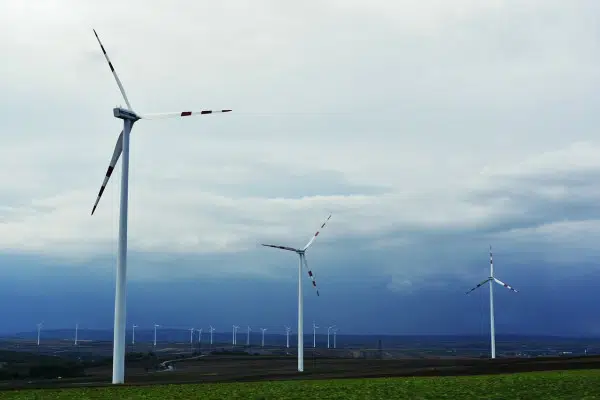
Wind power produces no direct greenhouse gas emissions from fuel combustion. Its life-cycle footprint comes mainly from steel, concrete, composites, manufacturing, transport, installation, maintenance, grid connections, and decommissioning.
NREL reports a 13 g CO2e/kWh median for land-based and offshore wind combined. The IPCC’s older harmonized dataset reports 11 for onshore wind and 12 for offshore wind. Actual projects differ, and responsible siting still matters for wildlife, habitats, communities, transmission, and visual impacts. Our guide to the pros and cons of wind energy covers those tradeoffs in more detail.
Nuclear power: very low life-cycle emissions, with separate tradeoffs
Nuclear fission does not release carbon dioxide through combustion during electricity generation. Its life-cycle emissions come from uranium mining and processing, fuel fabrication, plant construction, operations, maintenance, decommissioning, and the waste-management stages included in each assessment.
NREL’s median is 13 g CO2e/kWh, while the IPCC reports 12. That puts nuclear alongside wind in the lowest-emission tier. Greenhouse gas performance, however, does not settle every policy question: nuclear projects also involve radioactive waste, safety regulation, cooling-water needs, capital cost, construction time, and long-term oversight.
Hydropower: usually low, but reservoirs can change the result
Hydropower has a median of 21 g CO2e/kWh in NREL’s review. Run-of-river facilities and projects with limited flooded vegetation can have a small footprint, while some reservoirs release substantial methane as submerged organic material decomposes.
The variation is large enough that “hydropower is always carbon-free” is not defensible. The IPCC’s published range runs from 1 to 2,200 g CO2e/kWh, showing why project location, reservoir design, climate, and ecosystem conditions must be assessed rather than assumed.
Solar power: low emissions that continue to improve
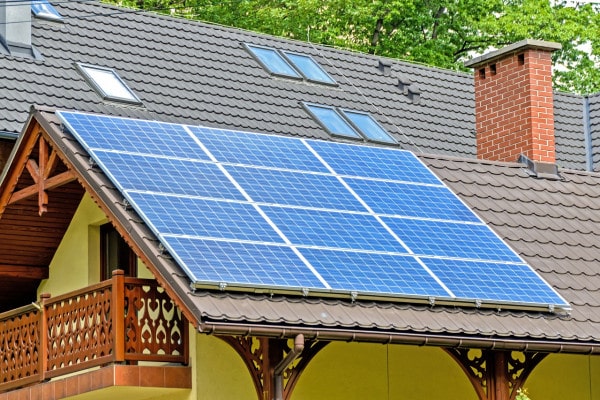
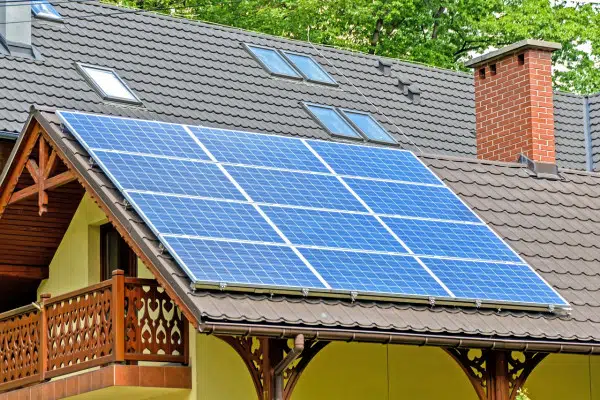
Solar photovoltaic systems have no direct combustion emissions while producing electricity. Most of their life-cycle footprint comes from manufacturing silicon, cells, modules, inverters, mounting systems, and other equipment, plus installation and end-of-life treatment.
NREL’s cross-study median is 43 g CO2e/kWh. A more recent 2024 NREL analysis of modern U.S. utility-scale solar estimated 10 to 36 g CO2e/kWh across six manufacturing, location, and disposal scenarios. The same research estimated energy payback times of 0.5 to 1.2 years. Solar’s carbon payback varies more because it depends on the emissions of the local electricity it displaces.
For a household decision, compare roof orientation, shade, local solar resource, utility rates, incentives, installer quality, equipment warranty, and the carbon intensity of the local grid. Our solar-versus-wind comparison explains when each technology is a better fit.
Geothermal power: low-carbon, but site-dependent
Geothermal electricity has a median of 37 g CO2e/kWh in NREL’s comparison. Its footprint varies with drilling depth, plant type, reservoir chemistry, construction requirements, and operating conditions. It can provide steady low-carbon power where suitable geothermal resources exist, but it is not equally practical in every region.
Biomass: renewable does not automatically mean carbon-neutral

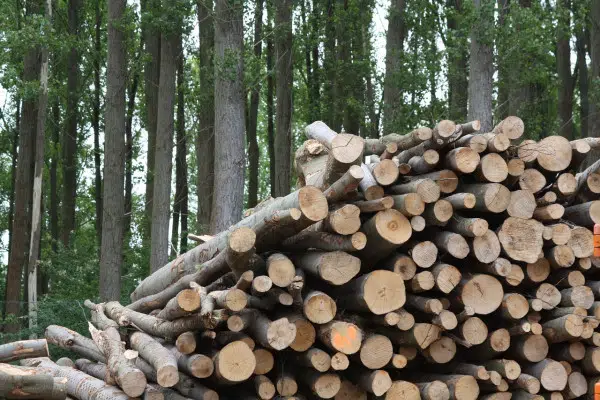
Biomass combustion releases carbon dioxide immediately. Plants may absorb carbon as they grow, but that does not make every biomass pathway neutral. The result depends on what material is burned, what would have happened to it otherwise, whether forests or soils lose carbon, how long regrowth takes, how far the fuel travels, and how efficiently it is converted into useful energy.
NREL lists a 52 g CO2e/kWh median, while the IPCC reports much higher figures for some dedicated biomass systems. The difference illustrates how strongly assumptions affect the answer. Read our overview of biomass energy and the main biomass feedstocks before treating it as a low-carbon substitute.
Natural gas, oil, and coal: the highest-emission sources
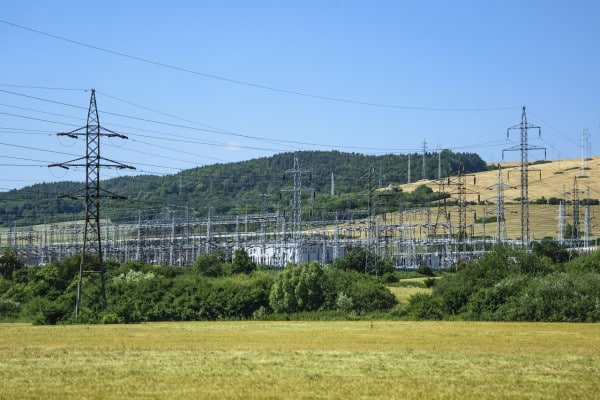
Fossil-fuel power remains much more greenhouse-gas-intensive because carbon is released during combustion. NREL reports medians of 486 g CO2e/kWh for natural gas, 840 for oil, and 1,001 for coal.
Natural gas generally emits less carbon dioxide at the power plant than coal, but it is still a fossil fuel. Methane released during production and transport adds to its life-cycle footprint. Coal remains the highest-emission source in the comparison. Extracting and transporting these fuels also creates environmental impacts beyond climate pollution; see how fossil fuels are extracted.
Which energy source is best in practice?
If the only criterion is median life-cycle greenhouse gas emissions, the best-supported answer for established electricity generation is wind or nuclear. If every technology in NREL’s dataset is included, ocean energy has a lower published median, but the evidence is less mature.
Electric grids cannot be planned on one emissions number alone. Wind and solar output varies with weather and time of day. Nuclear, geothermal, and some hydropower can provide steadier output. Storage, transmission, flexible demand, interconnection, reserve capacity, project lead times, local resources, and community acceptance all shape the practical mix.
- Lowest-emission established options: Wind and nuclear.
- Low-emission variable options: Wind and solar.
- Low-emission firm or dispatchable options: Nuclear, geothermal, and suitable hydropower projects.
- Most project-sensitive: Hydropower and biomass.
- Highest-emission conventional options: Coal, oil, and natural gas.
The strongest low-carbon strategy is usually a portfolio of well-sited resources rather than a claim that one technology solves every grid problem. Explore the broader types of green energy and compare their operational and environmental tradeoffs.
What homeowners and electricity customers can do
- Reduce wasted energy first. Insulation, efficient appliances, smart controls, and other home energy-saving measures can lower demand regardless of the local power mix.
- Check the electricity supply. Compare utility disclosures, community solar, credible green tariffs, or supplier options where available. Verify what resource is being purchased and whether the claim is backed by recognized certificates.
- Assess rooftop solar on local facts. A suitable roof in a sunny area with a carbon-intensive grid can deliver strong climate benefits. A shaded roof, poor financing, or a very low-carbon grid may change the case.
Frequently asked questions
Which energy source has the lowest life-cycle greenhouse gas emissions?
Among established electricity sources, wind and nuclear have the lowest well-supported median life-cycle emissions. NREL reports about 13 g CO2e/kWh for each. Ocean energy is listed at 8 g CO2e/kWh, but that result is based on a much smaller body of evidence.
Does nuclear power produce greenhouse gases?
Nuclear reactors do not burn fossil fuel during electricity generation, so direct operational greenhouse gas emissions are very low. Life-cycle emissions still arise from uranium mining and processing, fuel fabrication, construction, maintenance, decommissioning, and waste-management activities.
Does wind or solar power produce less greenhouse gas?
Wind is lower in NREL’s cross-technology median comparison: about 13 g CO2e/kWh for wind versus 43 for solar photovoltaic power. Modern solar installations can be lower than that historical cross-study median; a 2024 NREL study estimated 10 to 36 g CO2e/kWh for six U.S. utility-scale scenarios.
Is hydropower always a low-carbon energy source?
No. Many hydropower projects have very low life-cycle emissions, but reservoirs can release methane when flooded organic matter decomposes. Site conditions, reservoir design, climate, and the amount of flooded vegetation can change the result substantially.
Is biomass energy carbon-neutral?
Not automatically. Biomass releases carbon dioxide when burned. Its net climate effect depends on the feedstock, land-use change, forest and soil carbon, regrowth time, transport, processing, and what would have happened to the material without energy use.
Which energy sources produce no greenhouse gases while operating?
Wind, solar, and nuclear produce little or no direct greenhouse gas emissions while generating electricity. Hydropower turbines do not burn fuel, but some reservoirs emit methane. None is literally emission-free over its full life cycle because materials, construction, maintenance, fuel supply where applicable, and end-of-life work create emissions.
Bottom line
Wind and nuclear are the lowest-greenhouse-gas choices among established electricity sources, based on the strongest cross-technology evidence. Ocean energy may be lower, but its evidence base is smaller. Solar, suitable hydropower, and geothermal are also low-carbon. Coal, oil, and natural gas are much higher.
The most useful decision is not to search for a perfectly impact-free source. It is to replace high-emission generation with a reliable mix of low-carbon resources, improve efficiency, and account honestly for local environmental and social tradeoffs. Individuals can start by reducing their carbon footprint with practical, verifiable actions.