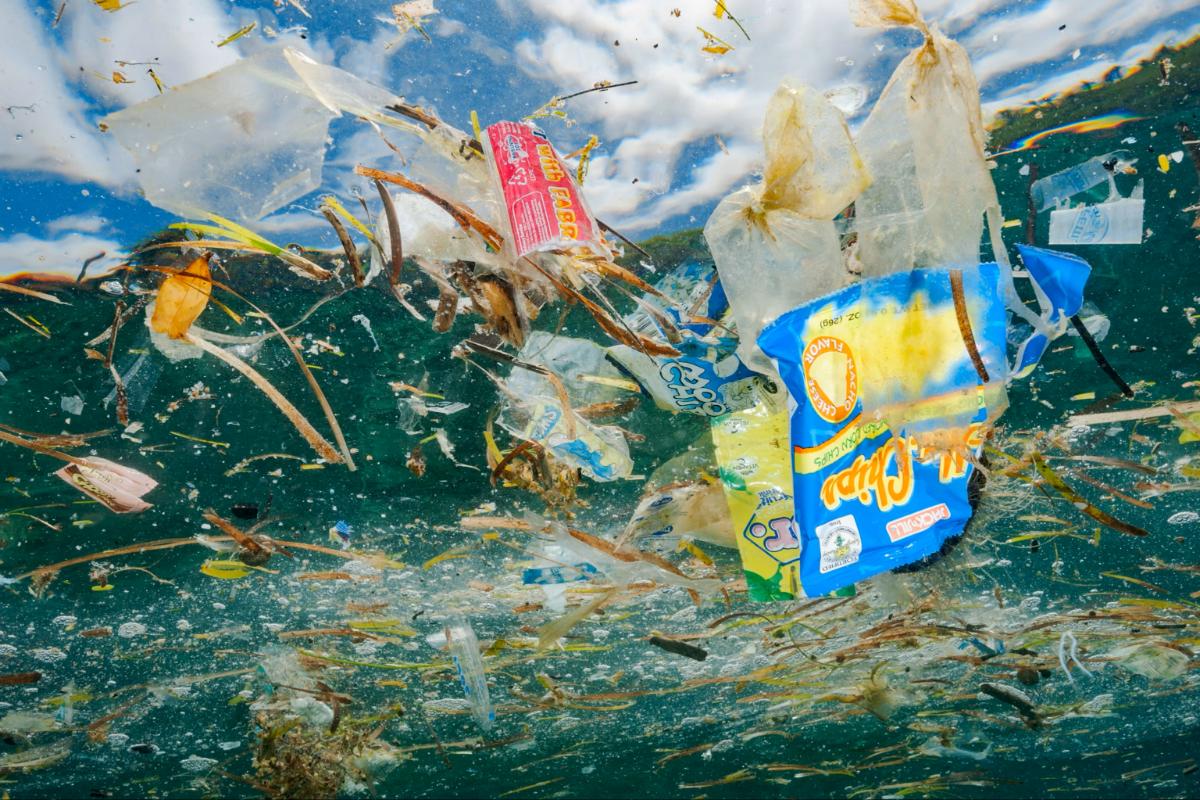
Ocean plastic pollution is best solved before waste reaches the water. The strongest response combines lower use of unnecessary plastic, reusable delivery systems, products designed for recovery, reliable waste collection, producer responsibility, controls on lost fishing gear, and interception in rivers and stormwater. Cleanup still matters—especially for beaches, harbors, derelict gear, and concentrated floating debris—but it cannot replace prevention.
The United Nations Environment Programme estimates that 19–23 million tonnes of plastic waste leak into aquatic ecosystems each year, including lakes, rivers, and seas. It also estimates that 75–199 million tonnes of plastic are already in the ocean. Those figures describe a system-wide pollution problem, not a single floating island of trash.
This article explains what ocean plastic includes, where it comes from, how it affects wildlife and people, and which interventions have the best chance of reducing harm. For the wider marine context—including oil, chemicals, nutrients, sewage, and noise—see our overview of ocean pollution causes and solutions. Our separate plastic pollution guide covers impacts across land, freshwater, and marine environments.
Ocean plastic pollution in five evidence-based facts
| Finding | What it means | Important qualification |
|---|---|---|
| 19–23 million tonnes of plastic waste leak into aquatic ecosystems each year | Plastic moves through connected land, river, lake, coastal, and marine systems. | This UNEP estimate covers aquatic ecosystems; it is not an ocean-only figure. |
| 75–199 million tonnes are estimated to be in the ocean | Legacy pollution remains after new leakage is reduced. | The range is wide because the deep ocean, seabed, coastlines, and small particles are difficult to measure. |
| More than 1,000 rivers account for 80% of modeled annual riverine emissions | Intervention is needed across many urban and regional waterways, not only a few famous rivers. | The peer-reviewed model estimated 0.8–2.7 million tonnes per year from rivers; it does not mean rivers carry 80% of all ocean plastic. |
| 9% of global plastic waste was ultimately recycled in 2019 | Recycling remains a supporting tool rather than a complete solution. | The OECD figure covers all global plastic waste, not only material at risk of entering the ocean. |
| Microplastics are smaller than 5 millimeters | They include fragments, fibers, pellets, and other small particles. | Their abundance, movement, and effects are still difficult to compare because sampling methods vary. |
What counts as ocean plastic?
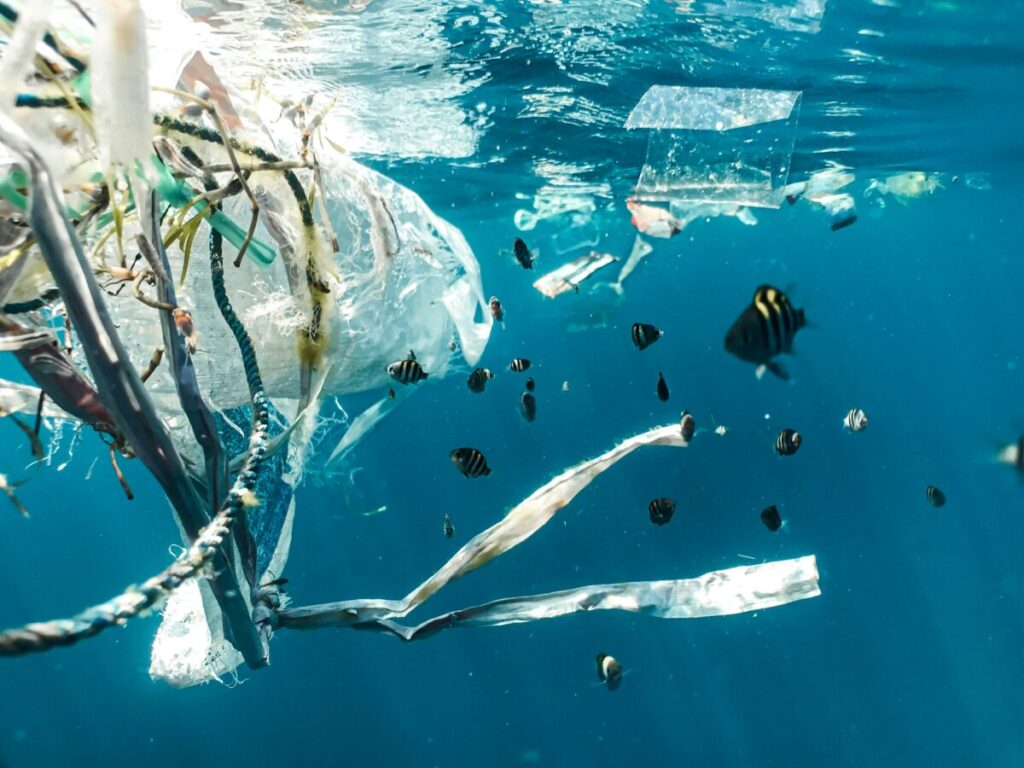
Ocean plastic ranges from large, recognizable objects to particles that require laboratory methods to detect. Treating every form as one problem leads to weak solutions: a beach cleanup can remove bottles and rope, but it cannot capture most fibers already dispersed through seawater.
Macroplastic debris
Macroplastics include bags, bottles, food packaging, crates, ropes, buoys, nets, and other items large enough to see without magnification. They can entangle wildlife, obstruct feeding, damage habitats, and break into progressively smaller fragments under sunlight, heat, abrasion, and wave action.
Microplastics
NOAA defines microplastics as plastic pieces less than five millimeters long. Some are manufactured at a small size, such as resin pellets. Others come from larger items, tire and road wear, synthetic textile fibers, paints, and coatings. Once dispersed, they are difficult to remove without also filtering organisms and natural particles.
Lost and abandoned fishing gear
Nets, lines, pots, traps, floats, and related equipment can become derelict after storms, vessel interactions, wear, accidental loss, or intentional disposal. NOAA describes this gear as a long-lived form of marine debris that can keep trapping animals after it leaves a fisher’s control—a process known as ghost fishing.

Where does ocean plastic come from?
There is no universal “80% from land and 20% from sea” split that applies across all places, years, particle sizes, and measurement methods. The relative contribution of household waste, rivers, stormwater, fishing gear, shipping, aquaculture, pellets, textiles, tires, and fragmented legacy debris changes by location and by what researchers count.
Inadequate collection, disposal, and litter control
The OECD Global Plastics Outlook estimated that inadequate collection and disposal caused 82% of global macroplastic leakage into the natural environment in 2019. That is strong evidence that basic waste services matter, but it should not be rewritten as “82% of ocean plastic.” The OECD figure includes leakage to land and water worldwide.
Rivers, storm drains, and flood events
Rivers connect inland waste to the coast. A 2021 Science Advances study modeled annual riverine plastic emissions at 0.8–2.7 million tonnes and found that more than 1,000 rivers accounted for 80% of that modeled flow. Small urban rivers were prominent, which means local stormwater and collection systems can matter as much as interventions on large river basins.
Fishing, aquaculture, and shipping
Marine industries contribute ropes, nets, pots, traps, packaging, and operational waste. Their global share is difficult to summarize with one percentage, yet their ecological importance can be high because lost gear is designed to catch animals and can remain active for years. Port reception, gear marking, loss reporting, retrieval programs, and designs that reduce ghost fishing address this pathway directly.
Wear, shedding, pellet loss, and fragmentation
Microplastics also enter through less visible routes. The OECD identifies tire and road-marking wear, accidental pellet loss, and washing of synthetic textiles among important sources. Larger debris then creates secondary microplastics as it weathers. This is why removing visible litter does not eliminate the need for product, transport, textile, and industrial controls.
How ocean plastic harms wildlife and ecosystems
Entanglement and ghost fishing
NOAA reports that marine debris affects more than 700 species. Nets, lines, packing bands, bag handles, and other loops can restrict movement, interfere with feeding and breathing, cut into tissue, or drown animals. Derelict gear can also scrape coral reefs and seagrass beds, foul vessels, and compete with active fisheries.
Ingestion
Animals may swallow plastic directly or consume prey that contains it. Large pieces can obstruct or injure the digestive tract and contribute to false satiation. Smaller particles can be taken up by plankton, shellfish, fish, seabirds, and other organisms, although effects vary by species, particle size, dose, and chemical composition. Sea turtles face both ingestion and entanglement risks; our sea turtle conservation guide explains the broader threats and protection work.
Habitat and ecosystem effects
Plastic can cover beaches and nesting sites, abrade reefs, alter seafloor sediments, and transport organisms beyond their normal ranges. At the smallest scales, researchers are studying how particles interact with plankton, microbes, nutrient cycling, and food webs. The evidence is sufficient to justify prevention, but not every proposed ecosystem effect has been quantified globally.
Human exposure is real; the health risk is still being defined
People are exposed to microplastics through food, water, and air. That does not support the common claim that everyone consumes a credit card’s weight of plastic each week. The World Health Organization has reviewed dietary and inhalation exposure and identified major research needs, while the European Food Safety Authority says the field still has significant data and methods gaps. The responsible conclusion is that exposure warrants reduction and research, not a precise universal dose or unsupported diagnosis.
Which ocean-plastic solutions work best?
The best intervention depends on where the plastic is in its lifecycle. Upstream measures prevent waste from being created or escaping. Midstream systems capture material before it disperses. Downstream cleanup removes legacy debris where it is concentrated and recoverable.
| Intervention | Best use | Main limitation |
|---|---|---|
| Reduction, reuse, and redesign | Avoiding unnecessary material and making reuse or recovery practical | Requires changes to products, supply chains, infrastructure, and consumer access |
| Reliable collection, deposit systems, and producer responsibility | Stopping discarded products from becoming leakage | Needs funding, enforcement, processing capacity, and equitable service |
| River and stormwater interception | Capturing concentrated floating waste before it reaches the coast | Treats leakage after it occurs and requires safe maintenance and disposal |
| Fishing-gear prevention and recovery | Reducing a high-harm form of debris that can keep catching wildlife | Requires cooperation, reporting, traceability, and fishery-specific design |
| Beach, harbor, and habitat cleanup | Removing local hazards, restoring access, and identifying recurring sources | Must be repeated if upstream leakage continues |
| Open-ocean collection | Recovering some floating macroplastic in accumulation zones | Cannot recover most dissolved pollutants, dispersed microplastics, buried debris, or seafloor plastic |
| Recycling | Keeping suitable, clean materials in use and reducing some virgin demand | Many products are uneconomic or technically difficult to recycle; collection is not proof of recycling |
1. Reduce, reuse, and redesign before disposal
UNEP’s Turning off the Tap report places systems change ahead of cleanup. It calls for reducing problematic and unnecessary plastic, redesigning products and packaging, expanding reuse, reorienting to suitable alternatives, improving recycling, and addressing legacy pollution.
- Eliminate material that serves no necessary function. Examples include avoidable secondary wrapping, default disposable accessories, and packaging that could be replaced by concentrated or refillable delivery.
- Design reuse as a service. Durable containers work only when return, washing, storage, and redistribution are convenient and safe.
- Simplify products for recovery. Fewer polymers, separable components, clear labels, and reduced use of problematic additives can improve sorting and recycling.
- Use procurement to create demand. Governments, institutions, and companies can specify reusable systems and verified recycled content rather than relying on vague “eco-friendly” claims.
Producer responsibility and deposit-return systems
Extended producer responsibility, or EPR, makes producers responsible for products across the lifecycle, including the post-consumer stage. Well-designed fees can help finance collection and processing while rewarding packaging that is reusable or easier to recover. Deposit-return systems create a direct incentive to bring eligible containers back through a clean, dedicated stream. Our review of effective recycling programs around the world shows how infrastructure, incentives, and transparent reporting work together.
Alternative materials need a defined end-of-life route
Biobased, biodegradable, and compostable are not interchangeable claims. A biobased plastic may not biodegrade. Compostable packaging usually needs collection and controlled composting conditions, and the European Commission notes that there is no general standard for marine biodegradation. These materials should solve a specific system problem—not excuse littering. See our comparison of home-compostable and industrially compostable materials before relying on a label.
2. Build collection systems that stop leakage
Waste prevention is strongest when paired with dependable collection. Overflowing bins, informal dumping, open burning, exposed disposal sites, weak storm-drain maintenance, and missing service in low-income or remote communities all create pathways to water.
- Provide universal, affordable collection. A policy cannot prevent leakage where households and businesses have no reliable service.
- Separate priority streams. Beverage containers, fishing gear, organics, hazardous waste, and bulky items need different collection and handling routes.
- Protect workers. Waste pickers and collection crews need fair compensation, safe conditions, equipment, and a role in system design.
- Control losses from facilities. Covered transport, pellet-containment plans, stormwater filters, landfill controls, and transparent downstream contracts reduce escape.
- Publish destinations and rejects. Reporting only the amount collected can hide contamination, export, incineration, or disposal.
Collection policy must also avoid shifting pollution to communities with less political power. Exporting mixed waste, locating unsafe facilities in already burdened neighborhoods, or excluding informal workers can improve a headline metric while worsening human and environmental harm.
3. Intercept plastic in rivers and stormwater
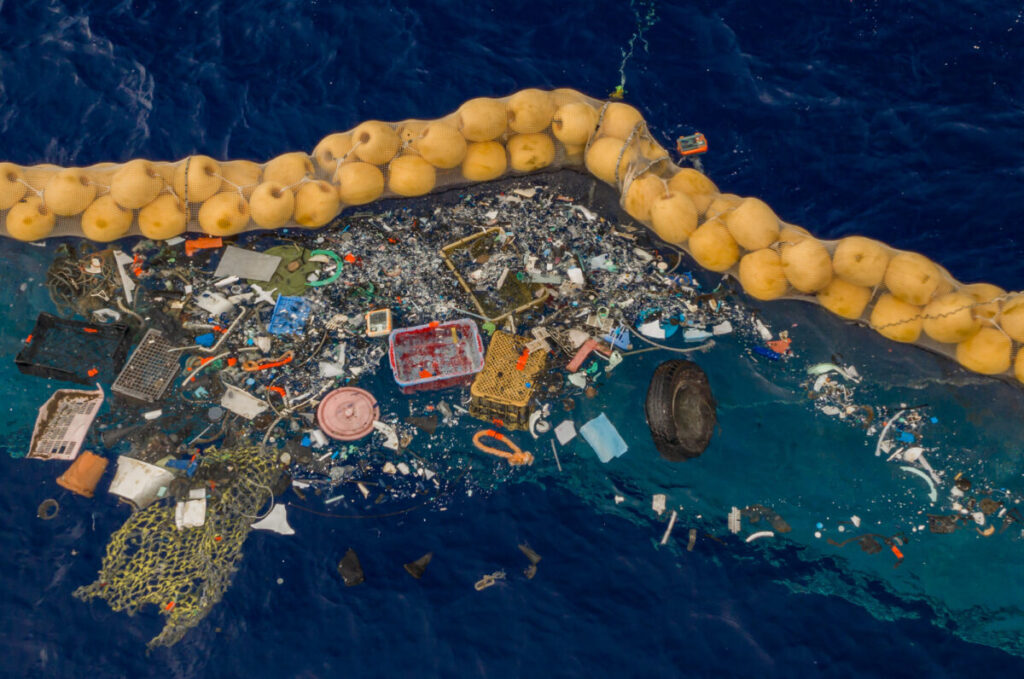
River booms, trash wheels, bubble barriers, screens, and other capture systems can remove floating debris at places where it is still concentrated. Their value is highest when operators know the local waste profile, can work safely during high flow, and have a verified plan for sorting and disposal.
- Measure the source and season. Rainfall, tides, festivals, markets, and collection failures can produce very different debris pulses.
- Protect navigation and wildlife. Barriers need bypasses, escape routes, and operating rules suited to local rivers.
- Plan maintenance before installation. A full or damaged device can release captured material or worsen flood risk.
- Audit what happens after capture. Mixed wet waste may have limited recycling value; removal is not the same as circular recovery.
- Use the data upstream. Brand, product, and material audits can identify preventable sources and support policy.
Interception works best as a diagnostic and containment layer within a wider collection system. It is not evidence that continued leakage is acceptable.
4. Prevent and recover lost fishing gear
Derelict gear deserves a separate strategy because it can continue catching animals. Prevention can include gear marking, electronic or physical tracking where practical, fisher-led reporting, port reception, retrieval incentives, spare-part standards, and designs that reduce continued capture if equipment is lost.
Recovery should involve fishers, harbor authorities, conservation groups, and habitat specialists. Sonar, surveys, and local knowledge can help locate gear, but removal from reefs or the seafloor can cause additional damage if done without the right equipment. Programs should record ownership where possible, release live animals, return usable gear, and recycle or dispose of the rest safely.
This work belongs within broader marine conservation, fisheries management, habitat protection, and worker-safety plans—not as a stand-alone cleanup campaign.
5. Use cleanup where it can measurably reduce harm
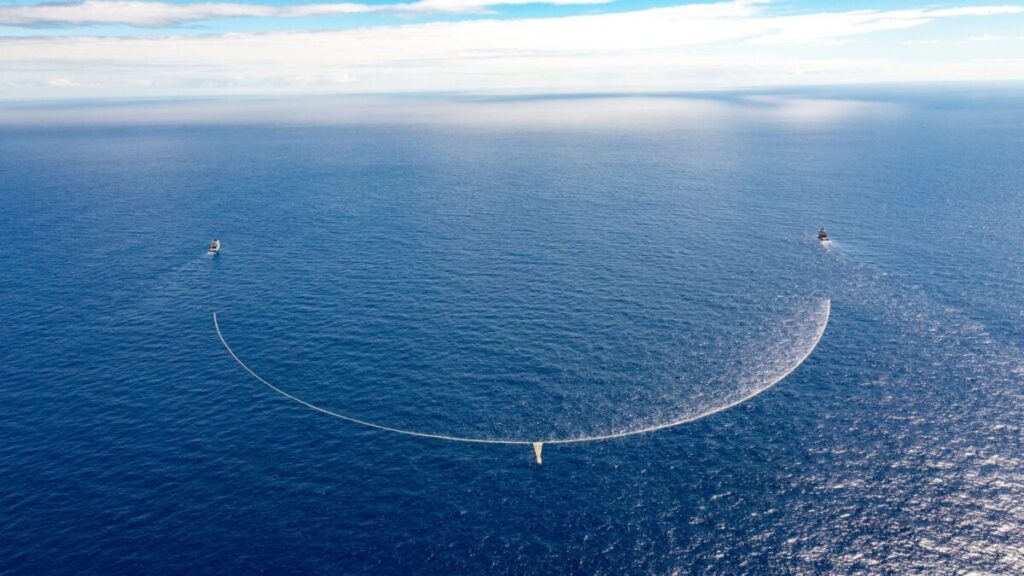
Targeted cleanup can produce immediate benefits. Removing a net from a reef, clearing a nesting beach before breeding season, collecting debris from a harbor, or recovering a concentrated surface accumulation can reduce direct hazards and restore access. Cleanups also generate source data when teams record the items they find.
What large cleanup systems can demonstrate
The Ocean Cleanup’s milestone page states that its river and ocean operations had captured 50 million kilograms of trash by March 2026. That is a self-reported operational figure across multiple programs, not a measure of the total ocean-plastic stock or proof that all captured material was recycled. It does show that engineered collection can remove substantial quantities in selected locations.
What cleanup cannot do
- Recover most microplastics already dispersed through the water column, sediments, organisms, and remote coastlines.
- Reach all plastic on the seafloor, buried in sediment, trapped in vegetation, or fragmented below practical collection sizes.
- Prevent replacement pollution when products, collection systems, and industrial practices remain unchanged.
- Guarantee a circular outcome; recovered material may be wet, degraded, mixed, or contaminated.
- Avoid every ecological tradeoff; devices and vessels need monitoring for bycatch, habitat effects, fuel use, noise, and storm risk.
6. Treat recycling as support, not permission to create unlimited waste
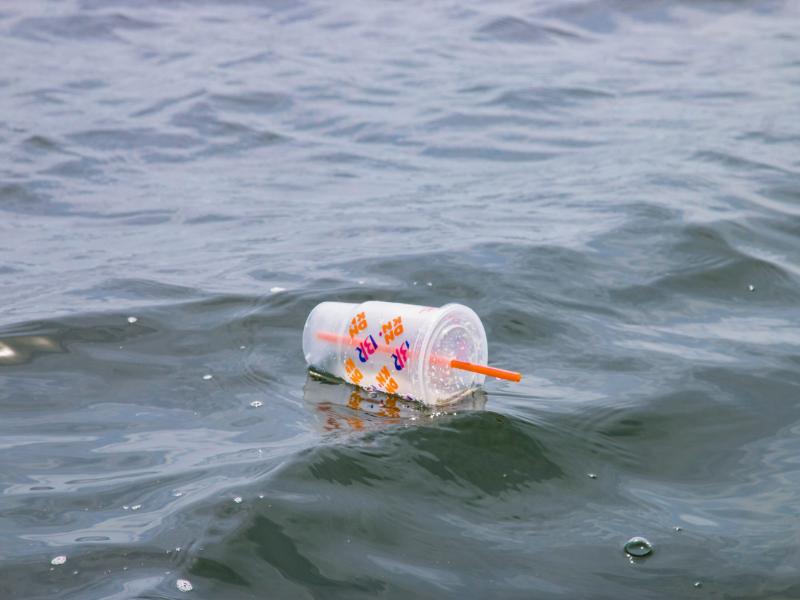
The OECD estimated that the world generated 353 million tonnes of plastic waste in 2019. Only 9% was ultimately recycled after processing losses; 19% was incinerated, almost half went to sanitary landfills, and the remaining 22% was dumped, openly burned, or leaked. Better recycling can improve material recovery, but those figures explain why recycling alone cannot carry the strategy.
Mechanical recycling is most credible for clean, well-sorted streams with stable markets. Mixed polymers, multilayer packaging, additives, labels, small formats, food residue, and weathering can reduce quality or make processing uneconomic. “Chemical recycling” covers several processes with different inputs, outputs, energy needs, emissions, and yields; claims should be assessed with transparent mass balances and lifecycle evidence rather than treated as one proven answer.
Ocean-recovered plastic is especially challenging because sunlight, salt, abrasion, and contamination degrade it. A cleanup program should report how much material was collected, how much was suitable for reuse or recycling, what processing losses occurred, and where the remainder went. Our analysis of why recycling cannot solve plastic pollution by itself explains the system constraints in more detail.
How to evaluate ocean-plastic statistics and claims
Ocean-plastic numbers are easy to misuse because studies measure different things. Before repeating a statistic, check six details:
- Scope: Does the figure cover the ocean, all aquatic ecosystems, or leakage to the entire natural environment?
- Flow or stock: Is it annual pollution entering a system, or the amount already accumulated there?
- Material size: Does it include macroplastics, microplastics, fishing gear, or only floating surface debris?
- Geography and date: Is the result global, regional, local, modeled, or measured during one season?
- Outcome: Does “removed” mean collected, recycled, reused, incinerated, landfilled, or safely disposed of?
- Evidence source: Is the number independently measured, peer reviewed, officially reported, or supplied by the organization describing its own program?
This discipline prevents a river estimate from becoming an ocean-wide percentage, a collection milestone from becoming a recycling claim, or a preliminary exposure study from becoming a universal health diagnosis.
Global plastics treaty status as of August 19, 2026
The international plastics treaty is still under negotiation. UNEP’s official process page lists activities leading to INC-5.4, including an informal heads-of-delegation meeting scheduled for September 27–30, 2026, and another informal meeting planned within January 25–February 2, 2027. A final legally binding instrument had not been adopted as of August 19, 2026.
An effective agreement could address plastic across its lifecycle: unnecessary production and use, product design, chemicals and additives, reuse systems, producer responsibility, waste services, pellet loss, fishing gear, finance, reporting, and support for workers and communities. The final obligations, timelines, and enforcement mechanisms remain unsettled, so articles should not present proposed provisions as agreed law.
What individuals and communities can do
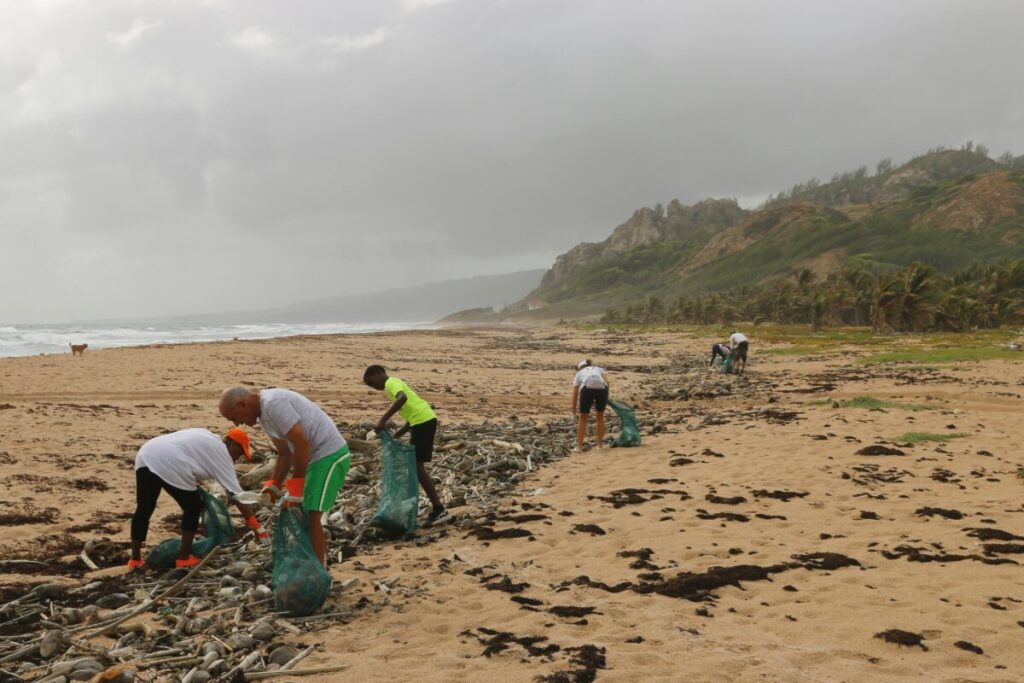
Individual action is most useful when it reduces repeated demand and supports better systems. It should not be used to transfer responsibility away from producers, retailers, governments, fishing fleets, and waste operators.
- Replace repeat disposables where reuse is practical. Start with items used weekly, such as bags, cups, food containers, and a durable reusable water bottle. Use what you already own before buying a collection of “green” substitutes.
- Follow local recycling rules. Empty and sort accepted items, keep prohibited materials out, and use specialist collection for batteries, electronics, films, or fishing line. Wishcycling can contaminate a load.
- Reduce avoidable microfiber and tire wear. Keep clothes in use longer, wash full loads when appropriate, maintain correct tire pressure, drive less where alternatives are practical, and support product-level filtration and abrasion standards.
- Join targeted cleanups with a disposal plan. Use gloves and safe handling, avoid disturbing nests or dunes, record the material and brands collected, and confirm where the waste will go before the event.
- Support policies that change the system. Deposit-return, producer responsibility, universal collection, pellet-loss controls, fishing-gear reporting, and reuse procurement can prevent more leakage than one-off swaps.
- Ask for measurable claims. Look for absolute plastic reduction, reuse rates, recycled-content verification, collection coverage, processing losses, and dates—not an undefined promise that packaging is “ocean friendly.”
The most skillful next action is specific and repeatable: remove one recurring source of waste in your household or organization, then support one policy or local system that makes the lower-waste choice available to more people.
Frequently asked questions
How much plastic enters the ocean each year?
Estimates vary because studies use different boundaries and methods. UNEP estimates that 19–23 million tonnes of plastic waste leak into aquatic ecosystems each year, including rivers, lakes, and seas. That figure should not be presented as an ocean-only measurement without explaining its scope.
Where does most ocean plastic come from?
There is no universal percentage that fits every region and type of debris. Inadequate collection and disposal, litter, rivers and stormwater, lost fishing gear, industrial pellet loss, textiles, tires, and fragmentation all contribute. Their relative importance changes by location and by whether a study measures macroplastics or microplastics.
Can ocean cleanup solve plastic pollution?
Cleanup can reduce immediate harm in beaches, harbors, reefs, rivers, and floating accumulation zones. It cannot recover most dispersed microplastics or stop new waste from entering the water. Prevention, reuse, product redesign, collection, producer responsibility, and source controls are still essential.
Are microplastics dangerous to human health?
People are exposed to microplastics through food, water, and air, but the size of the health risk is not yet established with confidence. WHO and EFSA have identified major data and methods gaps. Reducing exposure and pollution is prudent, but universal dose claims and specific health diagnoses are not supported.
Do biodegradable or compostable plastics break down in the ocean?
Not reliably. Biodegradation depends on the material and environmental conditions, while many compostable plastics require controlled industrial facilities. The European Commission notes that there is no general standard for marine biodegradation, so these labels should not be treated as permission to litter.
The practical order of action
Ocean plastic is both a flow problem and a legacy-pollution problem. The practical order is to reduce unnecessary material, build reuse and recovery into product design, fund reliable collection, prevent gear and industrial losses, intercept concentrated leakage, and then clean up the highest-risk debris already in the environment.
No single machine, material, company pledge, recycling label, or household habit can do all of that. A credible solution states which part of the system it changes, measures the result, discloses the tradeoffs, and keeps the burden from falling on wildlife or communities with the least power.